
Last Updated On : 12-Oct-2026
Creating Custom Dashboards, Views and Reports in VCF Operations
An administrator wants to graphically represent which ESX hosts have the highest memory ballooning activity. Which custom view in VCF Operations would satisfy this requirement?
A. List view with Host Systems and memory ballooning usage metrics
B. Trend view with Host System objects and memory ballooning usage metrics
C. Summary view with cluster-level memory ballooning average metrics
D. Distribution view with Host Systems and memory ballooning usage metrics
Explanation
To graphically represent which ESXi hosts have the highest memory ballooning activity, you need a view that can show multiple hosts and their associated ballooning metrics in a ranked, comparative format.
A List View is specifically designed to display tabular data about specific objects in the monitored environment . When configured with Host System objects and the memory ballooning usage metric (mem|vmmemctl_average), it can list all ESXi hosts, display their current or historical ballooning values, and sort the list to show which host has the highest activity at the top. The official VCF Operations documentation explains that when you select an ESXi host from such a list, all detailed utilization charts—including balloon memory metrics—are displayed for that selected host . This provides both the "graphical representation" (through charts) and the comparative ranking (through the sorted list) that the requirement asks for.
Why Other Options Are Incorrect
B. Trend view with Host System objects and memory ballooning usage metrics:
A Trend view shows how a single metric changes over time using a line chart. It is suitable for examining ballooning patterns for one host, but it cannot graphically compare which host has the highest ballooning activity across multiple hosts simultaneously .
C. Summary view with cluster-level memory ballooning average metrics:
This view aggregates data at the cluster level, hiding individual host performance. The requirement specifically asks for identifying which ESX hosts have the highest activity, not the average behavior of an entire cluster.
D. Distribution view with Host Systems and memory ballooning usage metrics:
A Distribution view groups metric values into predefined buckets or ranges (e.g., 0-100 MB, 100-500 MB, 500+ MB) to show the spread of a metric across objects. While useful for visualizing how many hosts fall into each activity range, it does not allow you to pinpoint exactly which single host is highest or rank them in order .
Reference
Broadcom TechDocs: ESXi Utilization Dashboard – "It lists all the ESXi hosts, sorted by the highest utilization...All the utilization charts display the key utilization metrics of the selected cluster. For memory, the high utilization counters are explicitly shown, for example balloon"
Broadcom TechDocs:Resource Pool Metrics – Provides the metric key for memory ballooning (mem|vmmemctl_average)
An administrator has been tasked with customizing the “Live! Heavy Hitters” Dashboard to include the metric “Cost | VM Cost Trend.” What action should the administrator take to complete this task?
A. Within the Manage Dashboards panel, click “Change Ownership” to assign edit permission and add the relevant metric
B. Within the Dashboards Overview panel, click the “Live! Heavy Hitters” Dashboard, click the Edit action and add the relevant metric
C. Within the Manage Dashboards panel, click the checkbox for the dashboard, click Edit and add the relevant metric
D. Within the Manage Dashboards panel, Export the dashboard and add the relevant metric
E. Within the Manage Dashboards panel, Clone the dashboard and add the relevant metric
Explanation:
To edit an existing dashboard such as "Live! Heavy Hitters" and add a new metric ("Cost | VM Cost Trend"), the administrator must navigate to the Manage Dashboards panel, select the dashboard by checking the checkbox, and then click the Edit action from the vertical ellipsis menu . Once in edit mode, you can add the metric by modifying the relevant widget (e.g., a View or Metric Chart widget) that displays cost data .
This matches the standard workflow documented for VCF Operations: from the left menu, click Dashboards, then the Manage tab, select the desired dashboard, click the vertical ellipsis, and choose Edit .
Why Other Options Are Incorrect
A. Change Ownership
– This action reassigns dashboard ownership to another user but does not allow editing of dashboard content or metrics . It has no effect on the metrics displayed.
B. Click the "Live! Heavy Hitters" Dashboard, click the Edit action
– While this describes the correct intent, the workflow is incomplete. The Edit action is accessed from the Manage Dashboards panel, not directly from the Dashboard Overview panel when viewing the dashboard .
D. Export the dashboard
– Exporting creates a JSON file for backup or migration purposes . It does not allow editing of the dashboard content.
E. Clone the dashboard
– Cloning creates a duplicate dashboard with a new name, preserving the original . While you could edit the cloned version, this creates an unnecessary duplicate rather than modifying the existing "Live! Heavy Hitters" dashboard. The question implies modifying the existing dashboard, not creating a copy.
Reference
Broadcom TechDocs:Manage Dashboards – "You can select a dashboard from the list, click the vertical ellipsis against each dashboard, and select the various options such as edit, delete, clone, and deactivate a dashboard" .
Broadcom TechDocs: Dashboards in VCF Operations – "You can clone and edit the predefined dashboards or start from scratch"
An administrator has just deployed a VMware Cloud Foundation Private Cloud and now must ensure it is correctly licensed. The administrator has registered the VCF deployment with the VCF Business Services console and has downloaded the necessary license file and keys. Which three products would be licensed using a license file? (Choose three.)
A. VMware Private AI Foundation with NVIDIA
B. VMware HCX Enterprise
C. VMware Data Services Manager
D. VMware vDefend
E. vSAN Add-on Capacity
F. VMware Tanzu Platform
✅ Explanation:
In VCF 9.0, license keys are no longer used. Licensing is managed through license files in the VCF Business Services Console, with two distinct types of licenses:
Primary License (e.g., VMware Cloud Foundation - cores) – Automatically licenses components like NSX, HCX, and Tanzu when assigned to a vCenter instance.
Add-on Licenses – Required for additional capacity beyond the base subscription.
A. VMware Private AI Foundation with NVIDIA
– Explicitly listed as a supported add-on license in VCF 9.0. It requires manual assignment to the management domain to activate the guided deployment UI.
B. VMware HCX Enterprise
– While HCX is included with the primary VCF license, the question references licensing using a license file. Pre-version 9 license keys included HCX Enterprise; however, in VCF 9.0, HCX functionality is entitled under the primary VMware Cloud Foundation (cores) license file. It does not require a separate add-on license file.
E. vSAN Add-on Capacity
– The official documentation states: "The two supported add-on licenses using the new licensing system are VMware vSAN (TiB) and VMware Private AI Foundation with NVIDIA (cores)". This is required when storage needs exceed the base vSAN entitlement (1 TiB per licensed core).
❌ Why Other Options Are Incorrect
C. VMware Data Services Manager (DSM)
– DSM is a DBaaS add-on to VCF but is licensed automatically under the primary VCF license when assigned to a vCenter instance. It does not require a separate add-on license file.
D. VMware vDefend
– In VCF 9.0, individual security components like vDefend are no longer licensed separately. They are automatically licensed when the primary VMware Cloud Foundation license is assigned to a vCenter instance.
F. VMware Tanzu Platform
– Tanzu capabilities (including Tanzu Kubernetes Grid) are included as product components of the primary VCF subscription. No separate license file is required.
📚 Reference
Broadcom TechDocs: Licensing Overview for VCF 9.0 – "The two supported add-on licenses...VMware vSAN (TiB) and VMware Private AI Foundation with NVIDIA (cores)".
Broadcom TechDocs: 9.0 Product Subscription and Licensing – Lists HCX Enterprise as a component licensed under the primary VCF (cores) license.
An administrator has set up managed Telegraf agents through the VMware Cloud Foundation Private Cloud
to monitor applications. Data has been collecting properly for the last three months, but gaps in the collection
have been noticed during Collector Group maintenance. The application teams have asked to reduce these
gaps going forward, so the administrator has decided to activate Application Groups High Availability on the
Collector Groups.
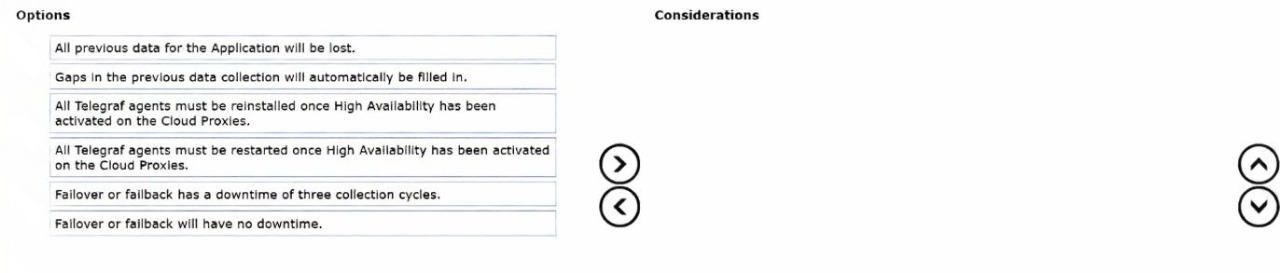
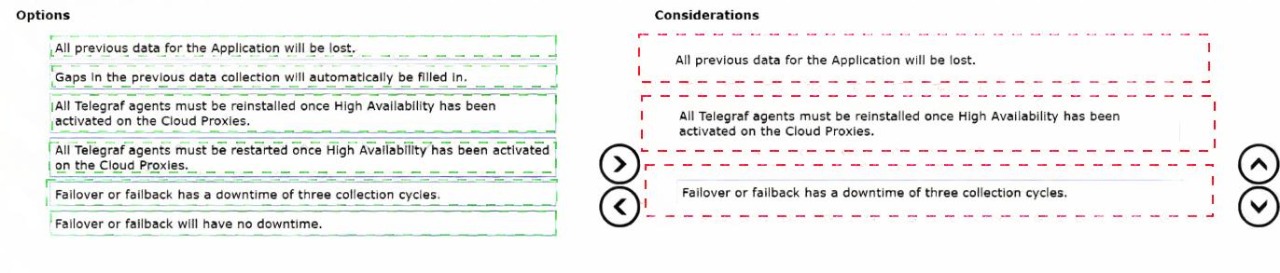
Drag and drop the three correct items the administrator must consider from the Options list on the left and
place them into the Considerations list on the right in any order. (Choose three.)
Explanation:
When activating High Availability (HA) for application monitoring utilizing managed Telegraf agents via Cloud Proxies in VCF Operations, the underlying architecture undergoes a major structural change. Here is why these considerations are critical:
All previous data for the Application will be lost:Enabling High Availability on an existing Collector Group resetting the application monitoring framework can cause existing historical metric assignments to become disconnected or erased for those specific agent configurations. This means that a backup or data export should be considered if the past 3 months of data are crucial.
All Telegraf agents must be reinstalled once High Availability has been activated on the Cloud Proxies: When HA is turned on, the configuration maps to an entire Collector Group (consisting of multiple Cloud Proxies working in an active-passive or balanced setup) rather than an individual Cloud Proxy endpoint. Because the endpoint certificate and configuration mapping change, any existing Telegraf agents must be cleanly reinstalled so they register against the HA-enabled group entity. Simply restarting the agents will fail to establish the correct multi-proxy failover endpoints.
Failover or failback has a downtime of three collection cycles: High Availability for application monitoring is not completely instantaneous. When a primary Cloud Proxy goes down, the system takes up to three collection cycles to definitively detect the heartbeat loss, declare a failure, and fully redirect the Telegraf agent metrics incoming pipeline to the secondary node.
Why the other options are incorrect:
Gaps in previous data collection will automatically be filled in: Historical collection gaps caused by previous single-point maintenance cannot retroactively be repaired or populated.
All Telegraf agents must be restarted...: As noted above, a simple service restart is insufficient because the agent needs the brand-new deployment configuration package linked to the HA group.
Failover or failback will have no downtime: This is false due to the built-in 3-cycle detection mechanism required to prevent flip-flopping or split-brain behaviors.
References
VMware Aria Operations / VCF Operations Documentation:Configuring Application Monitoring -> High Availability for Application Monitoring Cloud Proxies.
VMware KB / Architecture Guide: Explains the requirement of re-registering/re-deploying Telegraf agents when changing the deployment state of the target Cloud Proxies to an HA Collector Group configuration.
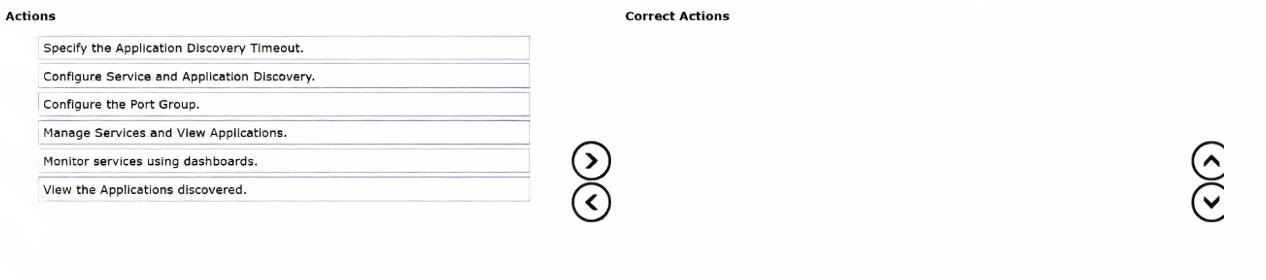
An administrator can discover and monitor services using VCF Operations.
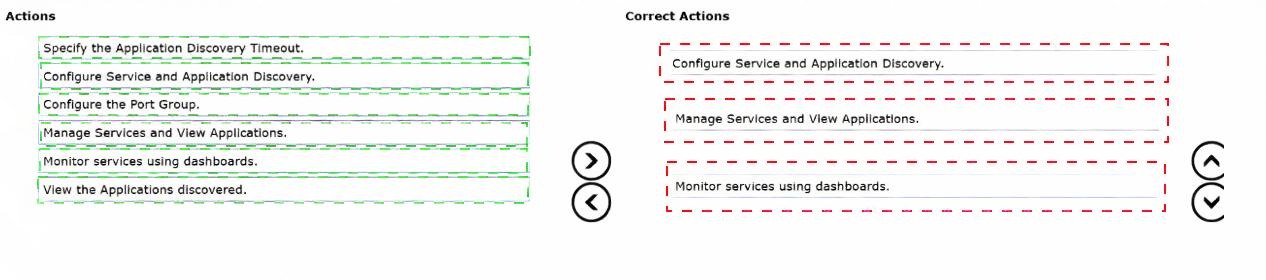
Which three actions should administrators take in VCF Operations to discover and monitor services and add
and view applications? (Choose three.)
Explanation:
VCF Operations utilizes the native Service Discovery engine (historically provided via the Service Discovery adapter) to automatically gather intelligence about the software workloads running inside guest operating systems across your virtual machines. The official workflow sequence strictly follows these operational building blocks:
Configure Service and Application Discovery:
This is the foundational administrative step. The administrator configures credentials, enables the data collection framework on targeted vCenter/ESXi clusters, and establishes how VCF Operations interacts with guest VMs to systematically look for well-known services (such as Apache, IIS, MSSQL, MySQL).
Manage Services and View Applications:
Once discovery processes run, administrators use this action area to organize the discovered items. Here, you can define specific application boundaries, build relationship maps between interdependent services spanning multiple VMs, and review exactly how workloads talk to one another
Monitor services using dashboards:
With the configurations and application definitions in place, monitoring is operationalized. VCF Operations Populates dedicated out-of-the-box dashboards (e.g., Service Discovery Dashboards) that visually chart the health, availability, performance anomalies, and infrastructure impact pathways of these logical applications.
Why the other options are incorrect:
Specify the Application Discovery Timeout: While configuration parameters exist under the hood, this is an option variable rather than one of the primary strategic action pillars outlined in the product workflow documentation.
Configure the Port Group: Port groups are network-level constructs managed inside vSphere Distributed Switches (VDS) or NSX virtual networking rather than inside VCF Operations for guest service discovery.
View the Applications discovered: The options block incorrectly formats the specific official administrative menu step, which is explicitly bundled together as "Manage Services and View Applications".
References
VMware Cloud Foundation 9.0 Workload Monitoring and Observability Guide: Discovering Services and Applications using the Service Discovery Adapter -> About Service Discovery.
VMware Aria Operations Configuration Guide: Integrating Data Sources -> Service and Application Discovery.
An administrator has been tasked with enabling Service Discovery within VCF Operations. What steps must an administrator take to install and configure Service Discovery?
A. Service Discovery is enabled by default for all servers with VMware Tools installed, no action required
B. Within Administration, click Integrations and modify the properties of the vCenter by selecting the Service Discovery radio button to activate
C. Within Infrastructure Operations, click Configurations, select Service Discovery and click “Configure Service Discovery”
D. Within Workload Operations, click Manage SDMP Services and select Actions “Activate Service Monitoring”
Explanation:
In VCF Operations (formerly VMware Aria Operations), Service Discovery is not enabled by default and requires specific configuration at the vCenter integration level. The administrator must navigate to Administration → Integrations, select the relevant vCenter adapter instance, click the pencil icon to edit its properties, and then locate and select the Service Discovery radio button to activate this feature. Once enabled, VCF Operations will automatically discover running services and application dependencies across VMs in that vCenter environment.
This configuration step is essential because Service Discovery operates at the vCenter integration level, not as a global toggle within Infrastructure Operations or Workload Operations menus.
Why Other Options Are Incorrect
A. Service Discovery is enabled by default for all servers with VMware Tools installed – This is false. Service Discovery is a discrete feature that must be manually enabled via the vCenter integration properties, regardless of VMware Tools presence.
C. Within Infrastructure Operations, click Configurations, select Service Discovery – This path does not exist in the VCF Operations UI for enabling Service Discovery. Infrastructure Operations is used for storage views, diagnostics, and log analysis, not for vCenter integration settings.
D. Within Workload Operations, click Manage SDMP Services – SDMP (Service Discovery and Monitoring Protocol) is not a valid interface option in VCF Operations. This appears to be a fabricated path referencing a non-existent workflow.
Reference
Broadcom TechDocs & VMware Blogs:"VCF Operations in VCF 9.0... Application Discovery and Service Discovery capabilities are enabled at the vCenter adapter level within the Integrations section of Administration
An administrator has installed and configured the Telegraf agent on Windows and Linux machines to capture OS and application metrics. The agent services have been started. What is the next step required to configure the Telegraf agent to send information to VCF Operations?
A. Ensure the operating systems can directly communicate with the VCF Operations Load Balancer
B. Ensure that the Telegraf services run as a user with Operator rights on VCF Operations
C. Download and run the helper script from the cloud proxy and restart the Telegraf service
D. Reboot the VCF Operations cloud proxies to enable collection data
✅ Explanation:
The scenario describes a key detail: the Telegraf agent has been installed manually (not deployed by VCF Operations) on Windows and Linux machines. In VCF Operations terminology, this is an Open Source Telegraf agent.
❌ Why Other Options Are Incorrect
A. Ensure the operating systems can directly communicate with the VCF Operations Load Balancer
– While network connectivity is required, open source Telegraf agents send metrics to the cloud proxy, not directly to the VCF Operations load balancer. The helper script explicitly requires the cloud proxy IP or FQDN as a parameter. Furthermore, connectivity alone does not configure the agent; configuration via the helper script is still required.
B. Ensure that the Telegraf services run as a user with Operator rights on VCF Operations
– Telegraf agent services run on the target machines (Windows/Linux) using local system accounts or a dedicated user (arcuser). These local credentials have no relationship to Operator rights within VCF Operations. VCF Operations permissions are relevant for API token generation and management operations, not for the service account running the Telegraf agent service.
D. Reboot the VCF Operations cloud proxies to enable collection data
– Rebooting cloud proxies is unnecessary and disruptive. Cloud proxies are designed to receive data continuously without requiring restarts after agent configuration. The helper script configures the agent to communicate with the cloud proxy; no changes are required on the cloud proxy side.
📚 References
Broadcom TechDocs: Monitoring Application Services and Operating Systems using Open Source Telegraf – "You can use open source Telegraf...to send metrics to VCF Operations using a helper script...The helper script adds necessary configurations in the Telegraf configuration that is directly identified by VCF Operations"
Broadcom Knowledge Base: Configure the Telegraf agent on a Linux VM – "Obtain the helper script from the cloud proxy...Run the helper script...Restart the telegraf agent"
An administrator notices that newly deployed Linux VMs in VCF Operations no longer provide service-level visibility through Service Discovery. The systems were hardened and unnecessary utilities were removed. VMware Tools is current and the Service Discovery plug-in is enabled. What are the two reasons Service Discovery is no longer functioning, and how can visibility be restored? (Choose two.)
A. You determine that the security team removed the netstat utility as unnecessary and restore it
B. Linux operating systems where the tcpdump utility is not present are not supported for Service Discovery
C. Linux operating systems where the socket statistics ss utility is not present are not supported for Service Discovery
D. You determine that the security team removed the socket statistics ss utility as unnecessary and restore it
E. You determine that the security team removed the tcpdump utility as unnecessary and restore it
F. Linux operating systems where the netstat utility is not present are not supported for Service Discovery
Explanation:
VMware Cloud Foundation (VCF) Operations uses the Service Discovery Management Pack (SDMP) via VMware Tools to execute credential-less or credential-based service scans inside the guest OS.
The Evolution of the Utility Requirements: In legacy versions of vRealize Operations (such as 8.1.x), the discovery script relied natively on the older netstat network utility to discover bound listening network ports and running processes. However, starting with vRealize Operations / VMware Aria Operations 8.2.x and continuing up through modern VCF Operations 9.0 releases, VMware completely transitioned the Linux agent discovery scripts away from netstat to favor the modern ss (Socket Statistics) utility.
The Root Cause: If a security team performs aggressive OS hardening on Linux templates and trims away what they assume are "unnecessary" network troubleshooting binaries, removing the ss utility completely breaks the underlying VMware Tools guest discovery script (get-versions.sh). Without ss, VMware Tools cannot return network socket states back to the SDMP framework.
The Solution: Restoring the ss binary (typically bundled inside the iproute2 package on modern Linux distributions) instantly fulfills the prerequisite, restoring complete application-level visibility.
Why the other options are incorrect:
A, E, and F are incorrect: Modern VCF Operations engines do not use or look for netstat inside modern Linux guest environments.
B is incorrect: While tcpdump is an active packet capture tool often restricted by security teams, it has no functional bearing on local socket state mapping used by VCF Service Discovery.
References
Broadcom Knowledge Base (KB 315992):
Credential-less Service Discovery functionality in vRealize Operations 8.2.x and later requires the use of ss from VMware Tools. Linux OSes running VMware Tools versions not using ss are not supported.
VMware Cloud Foundation Workload Monitoring and Observability Guide: Guest OS Prerequisites for Service Discovery.
| Page 2 out of 8 Pages |
| 123 |
| 3V0-22.25 Practice Test Home |